Year
2025
Category
Product
Country
United States
Design Studio / Department
Encora Digital Experience
Three questions to the project team
What was the particular challenge of the project from a UX point of view?
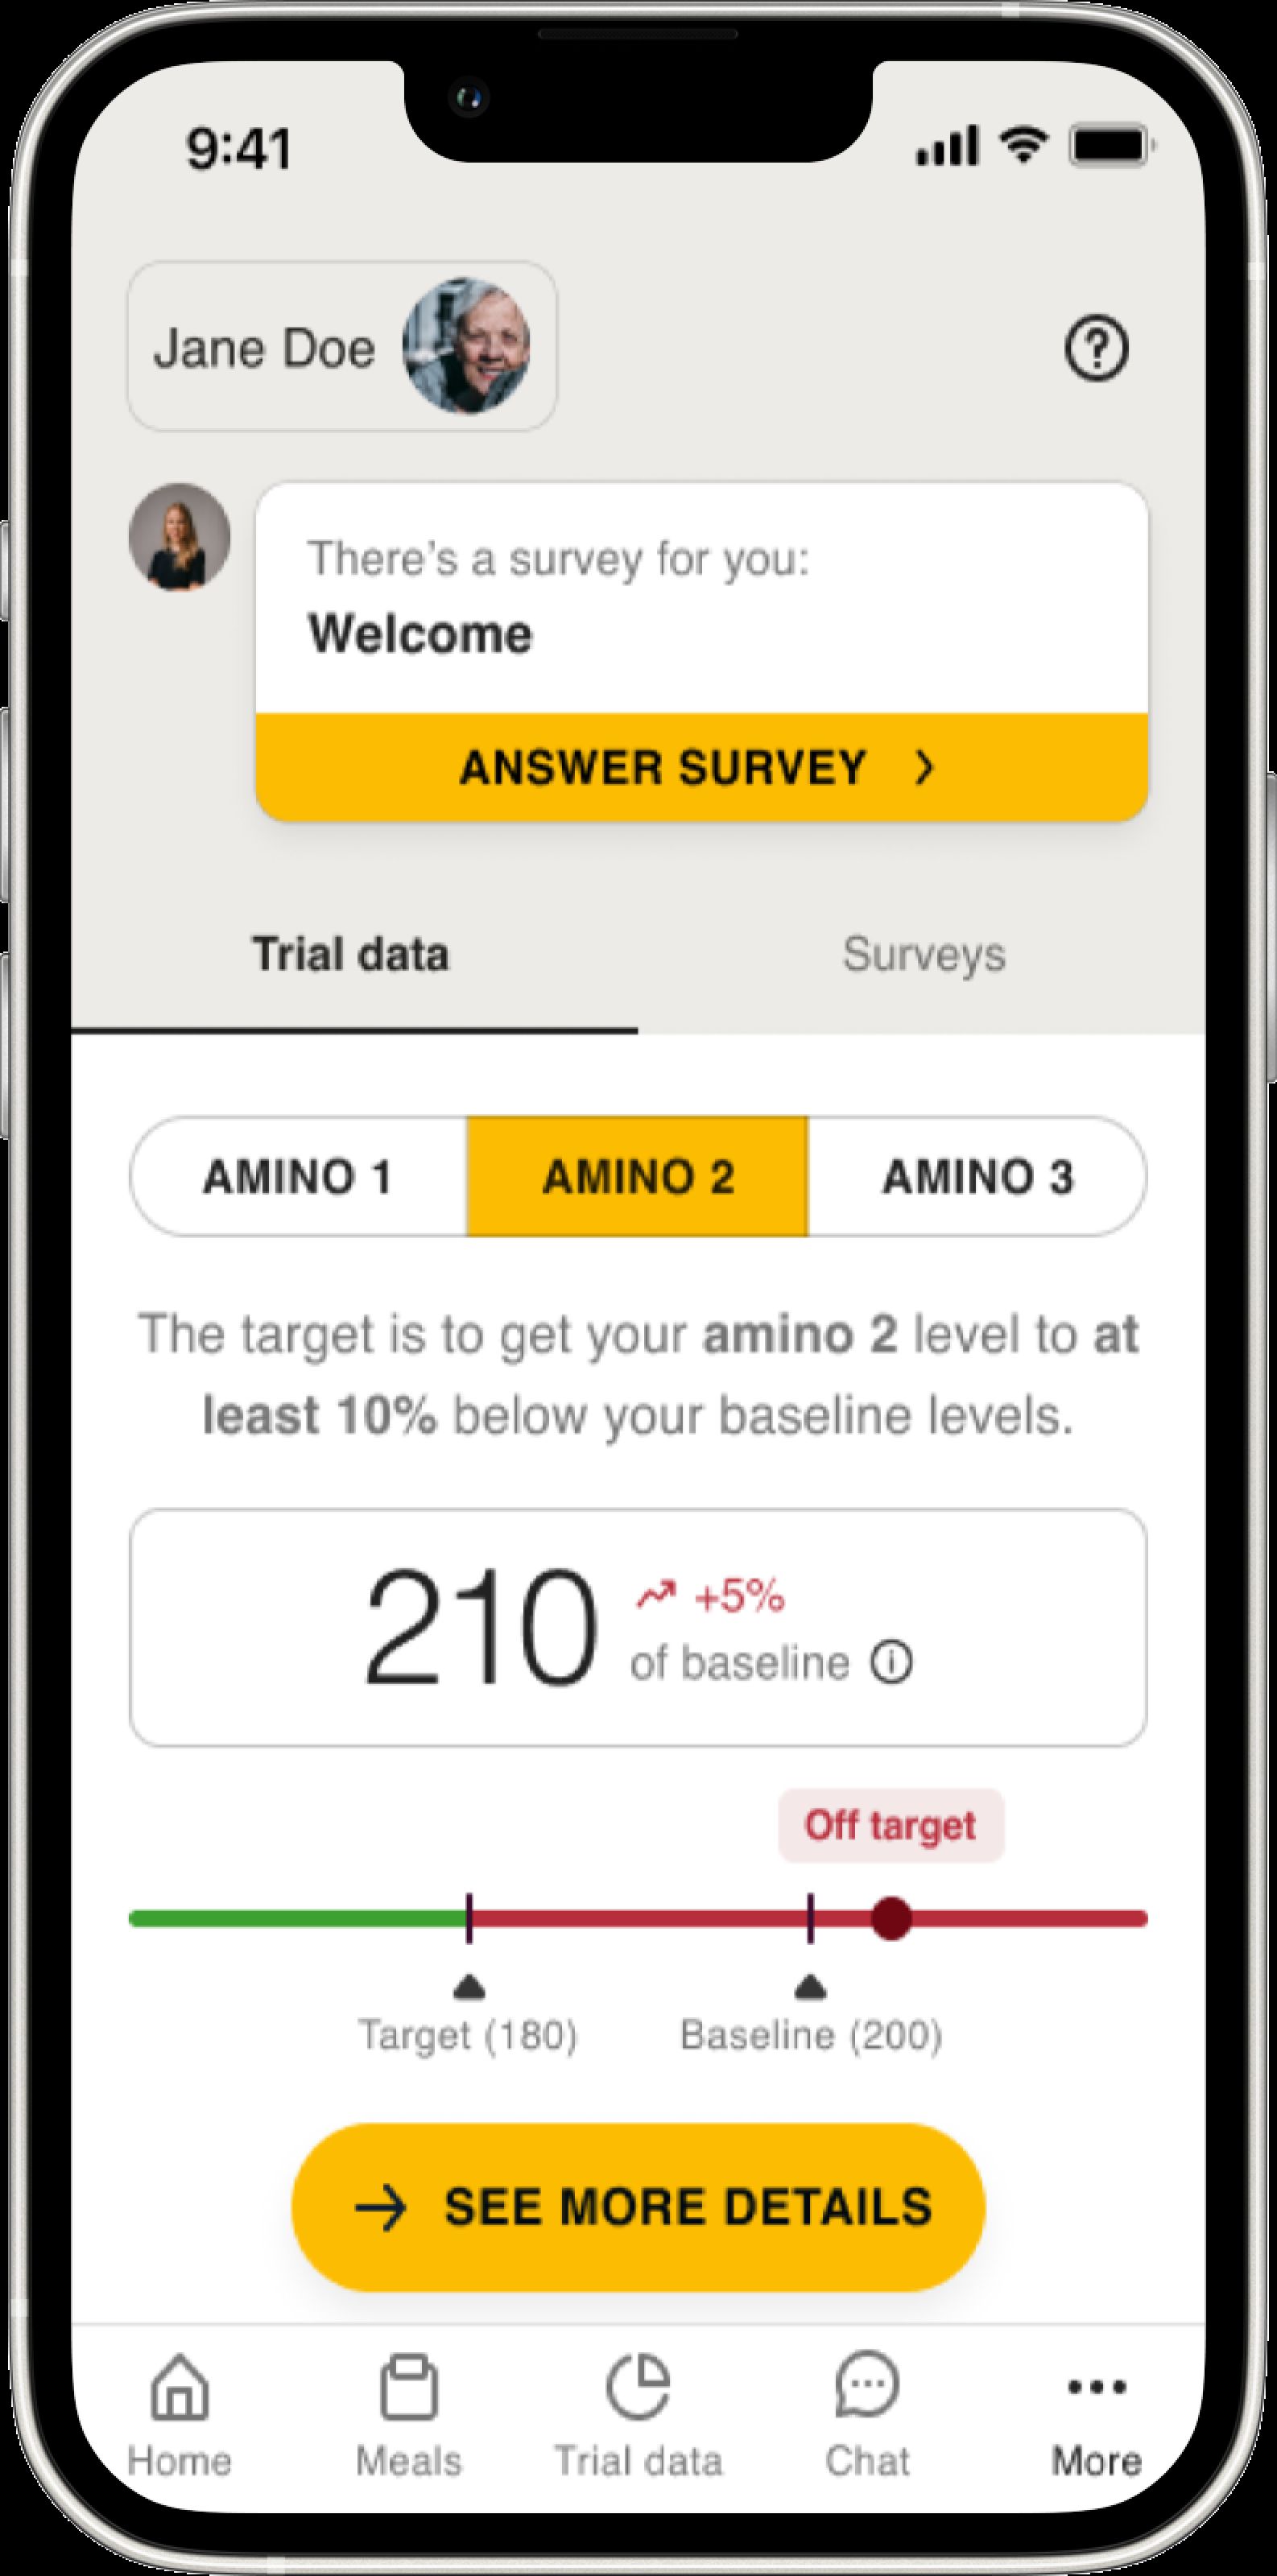
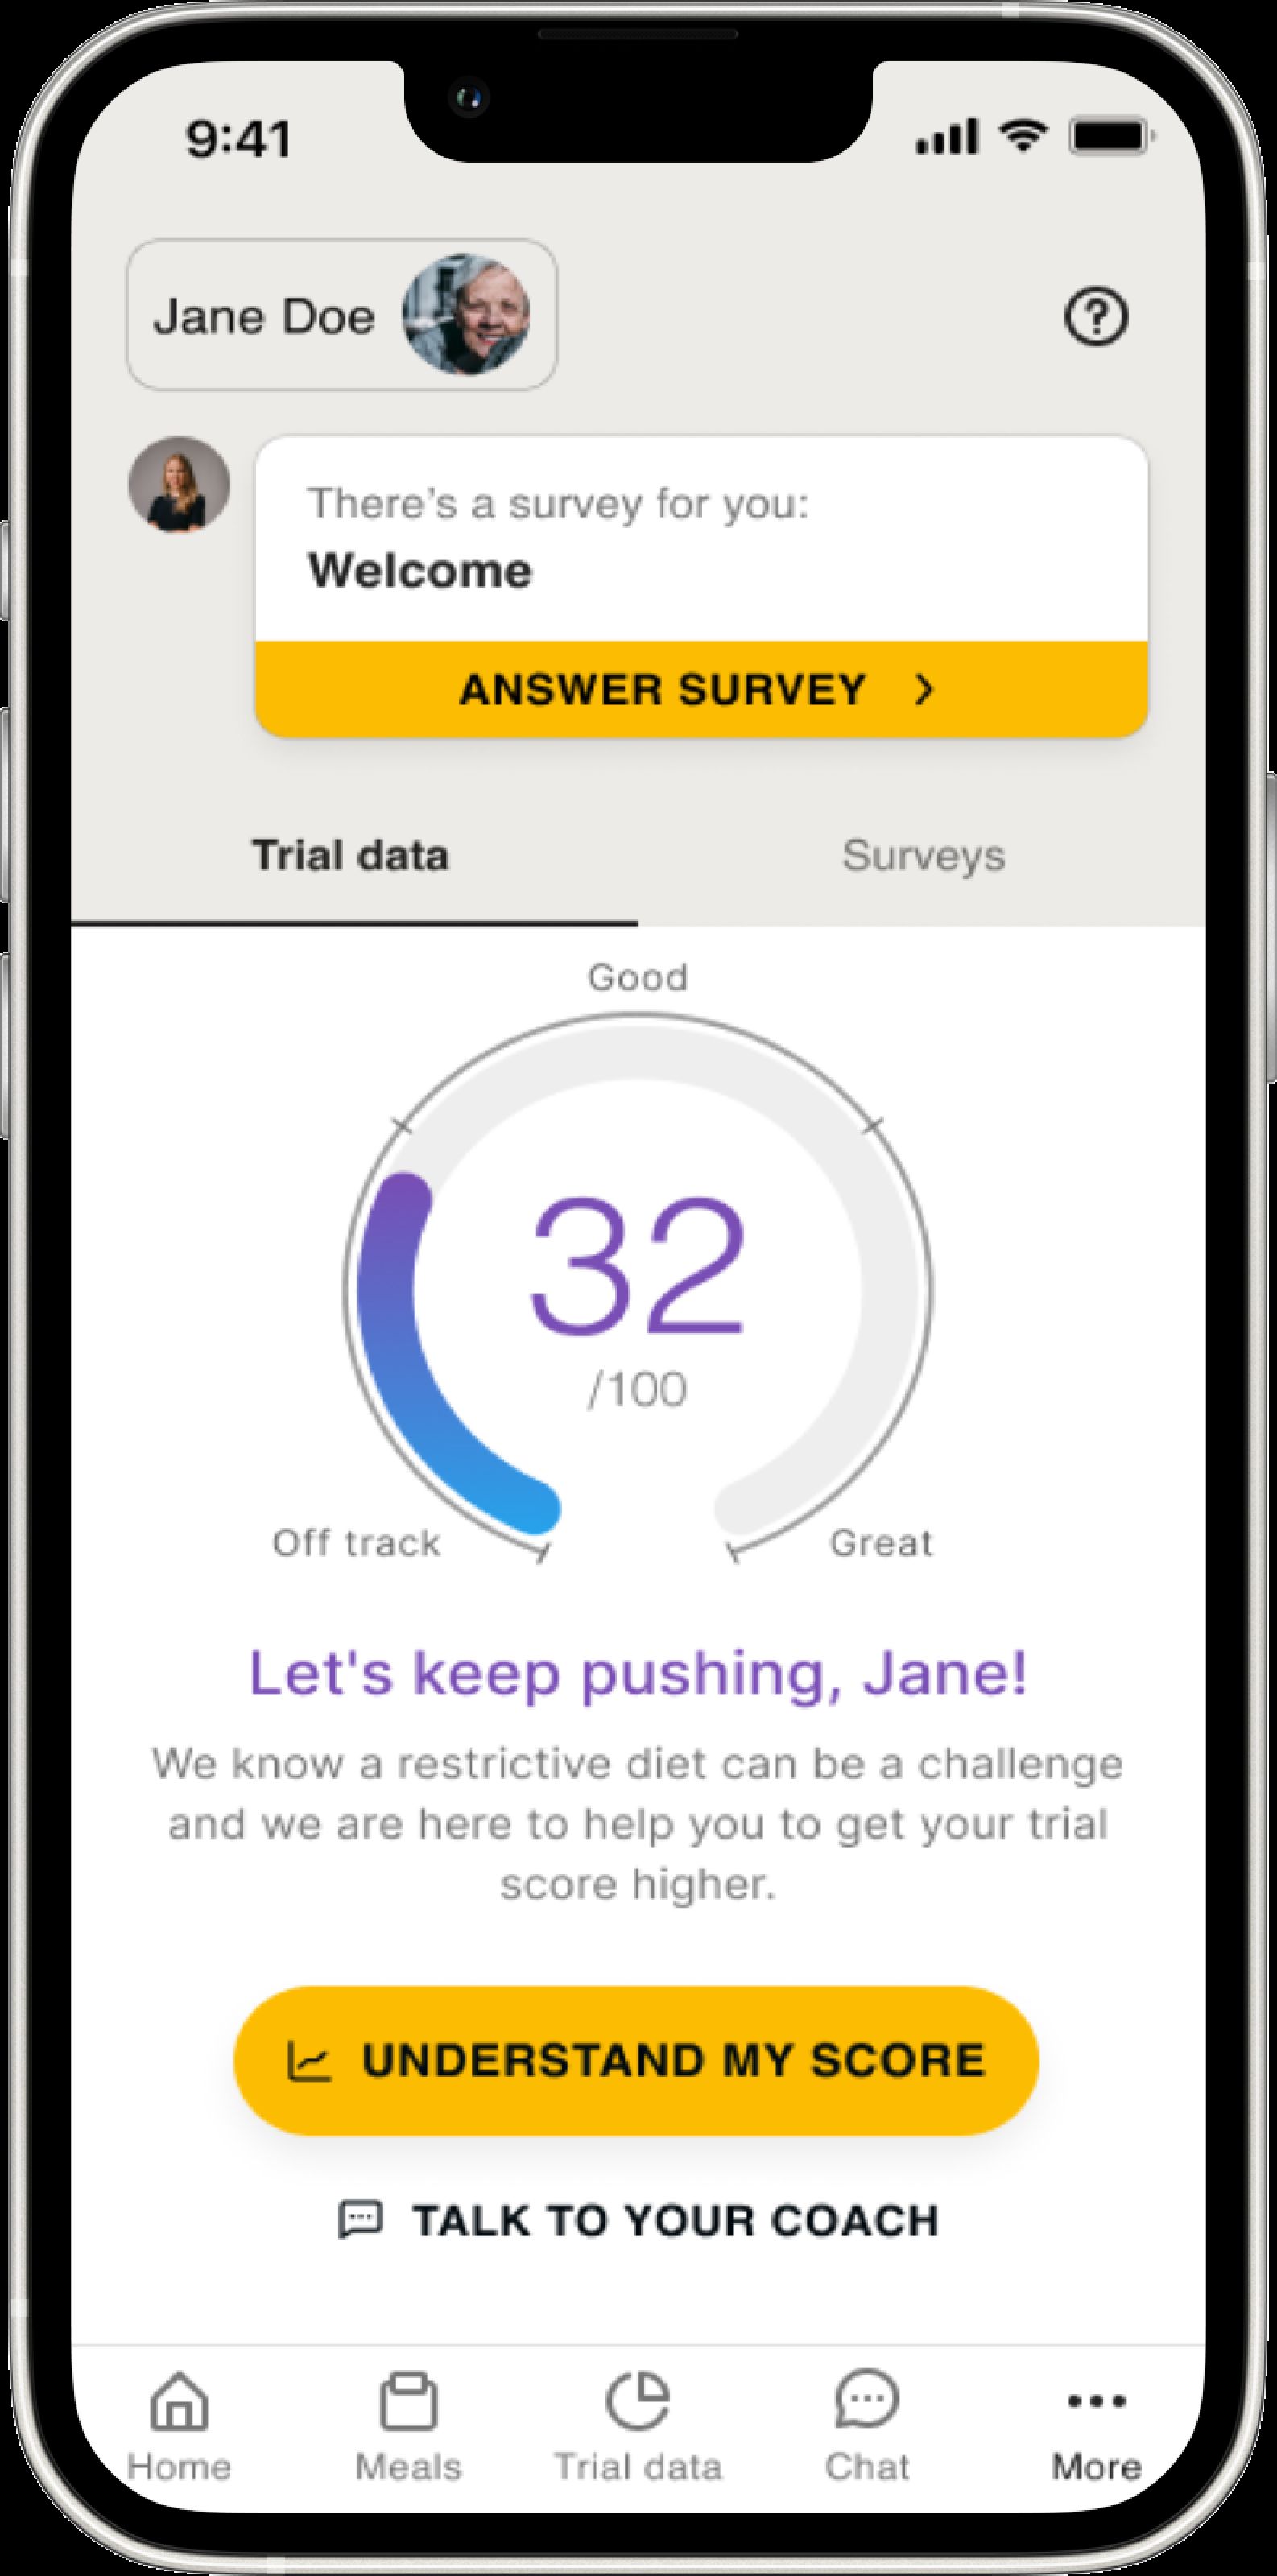
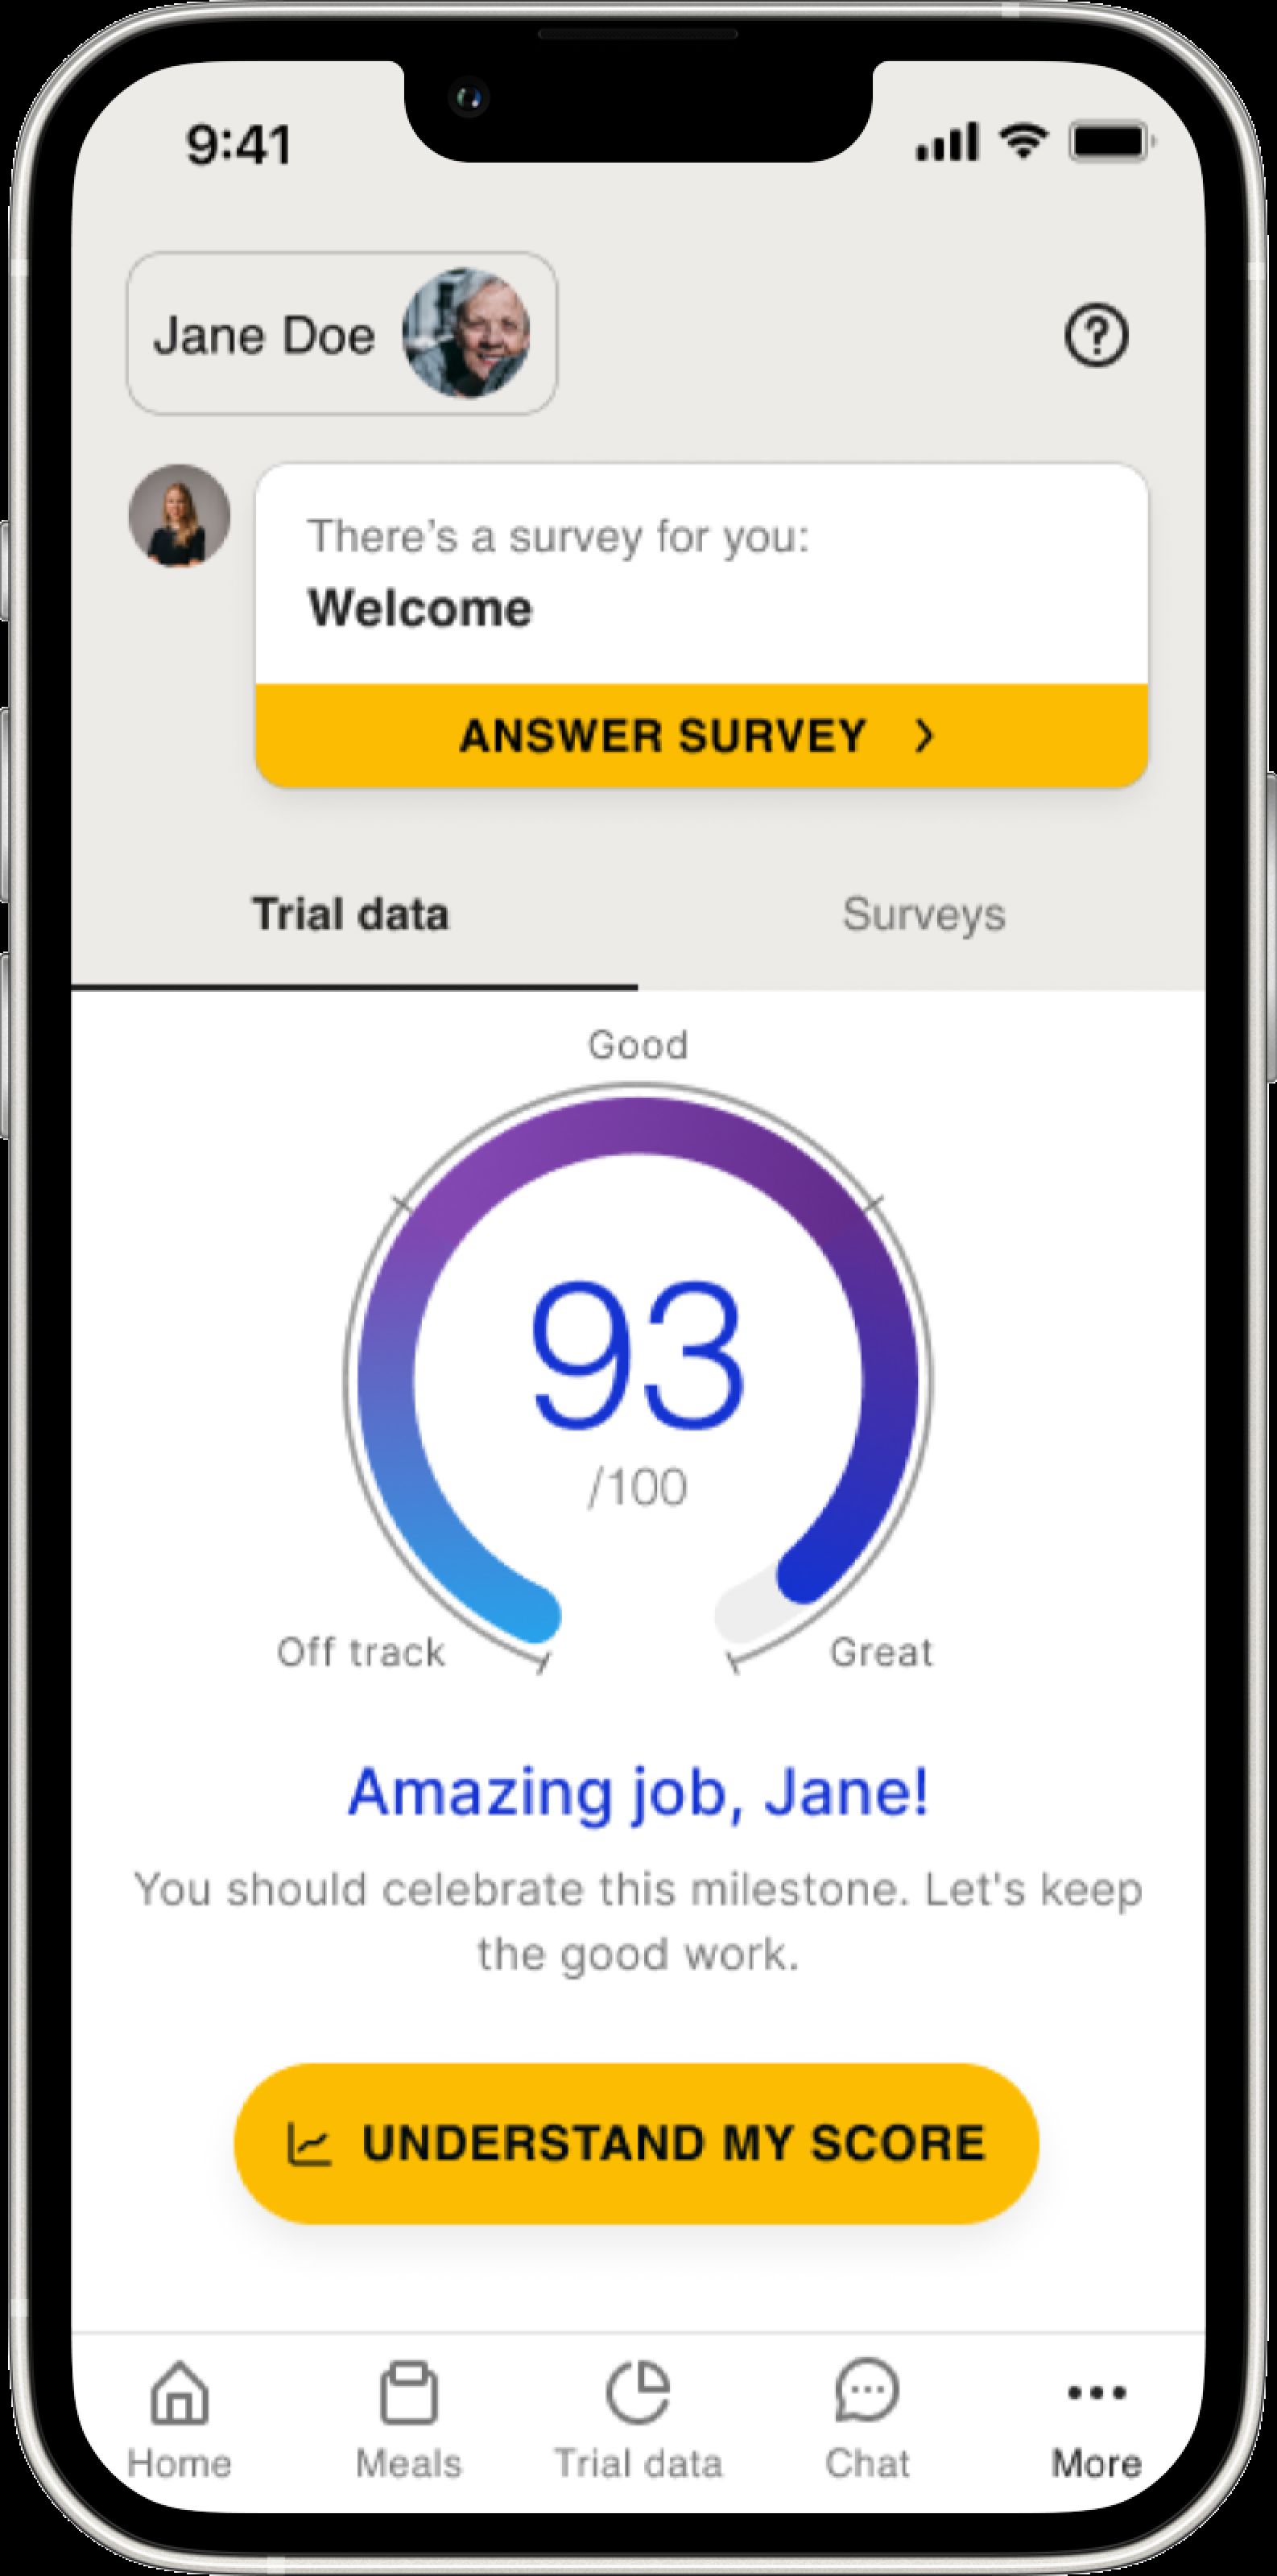
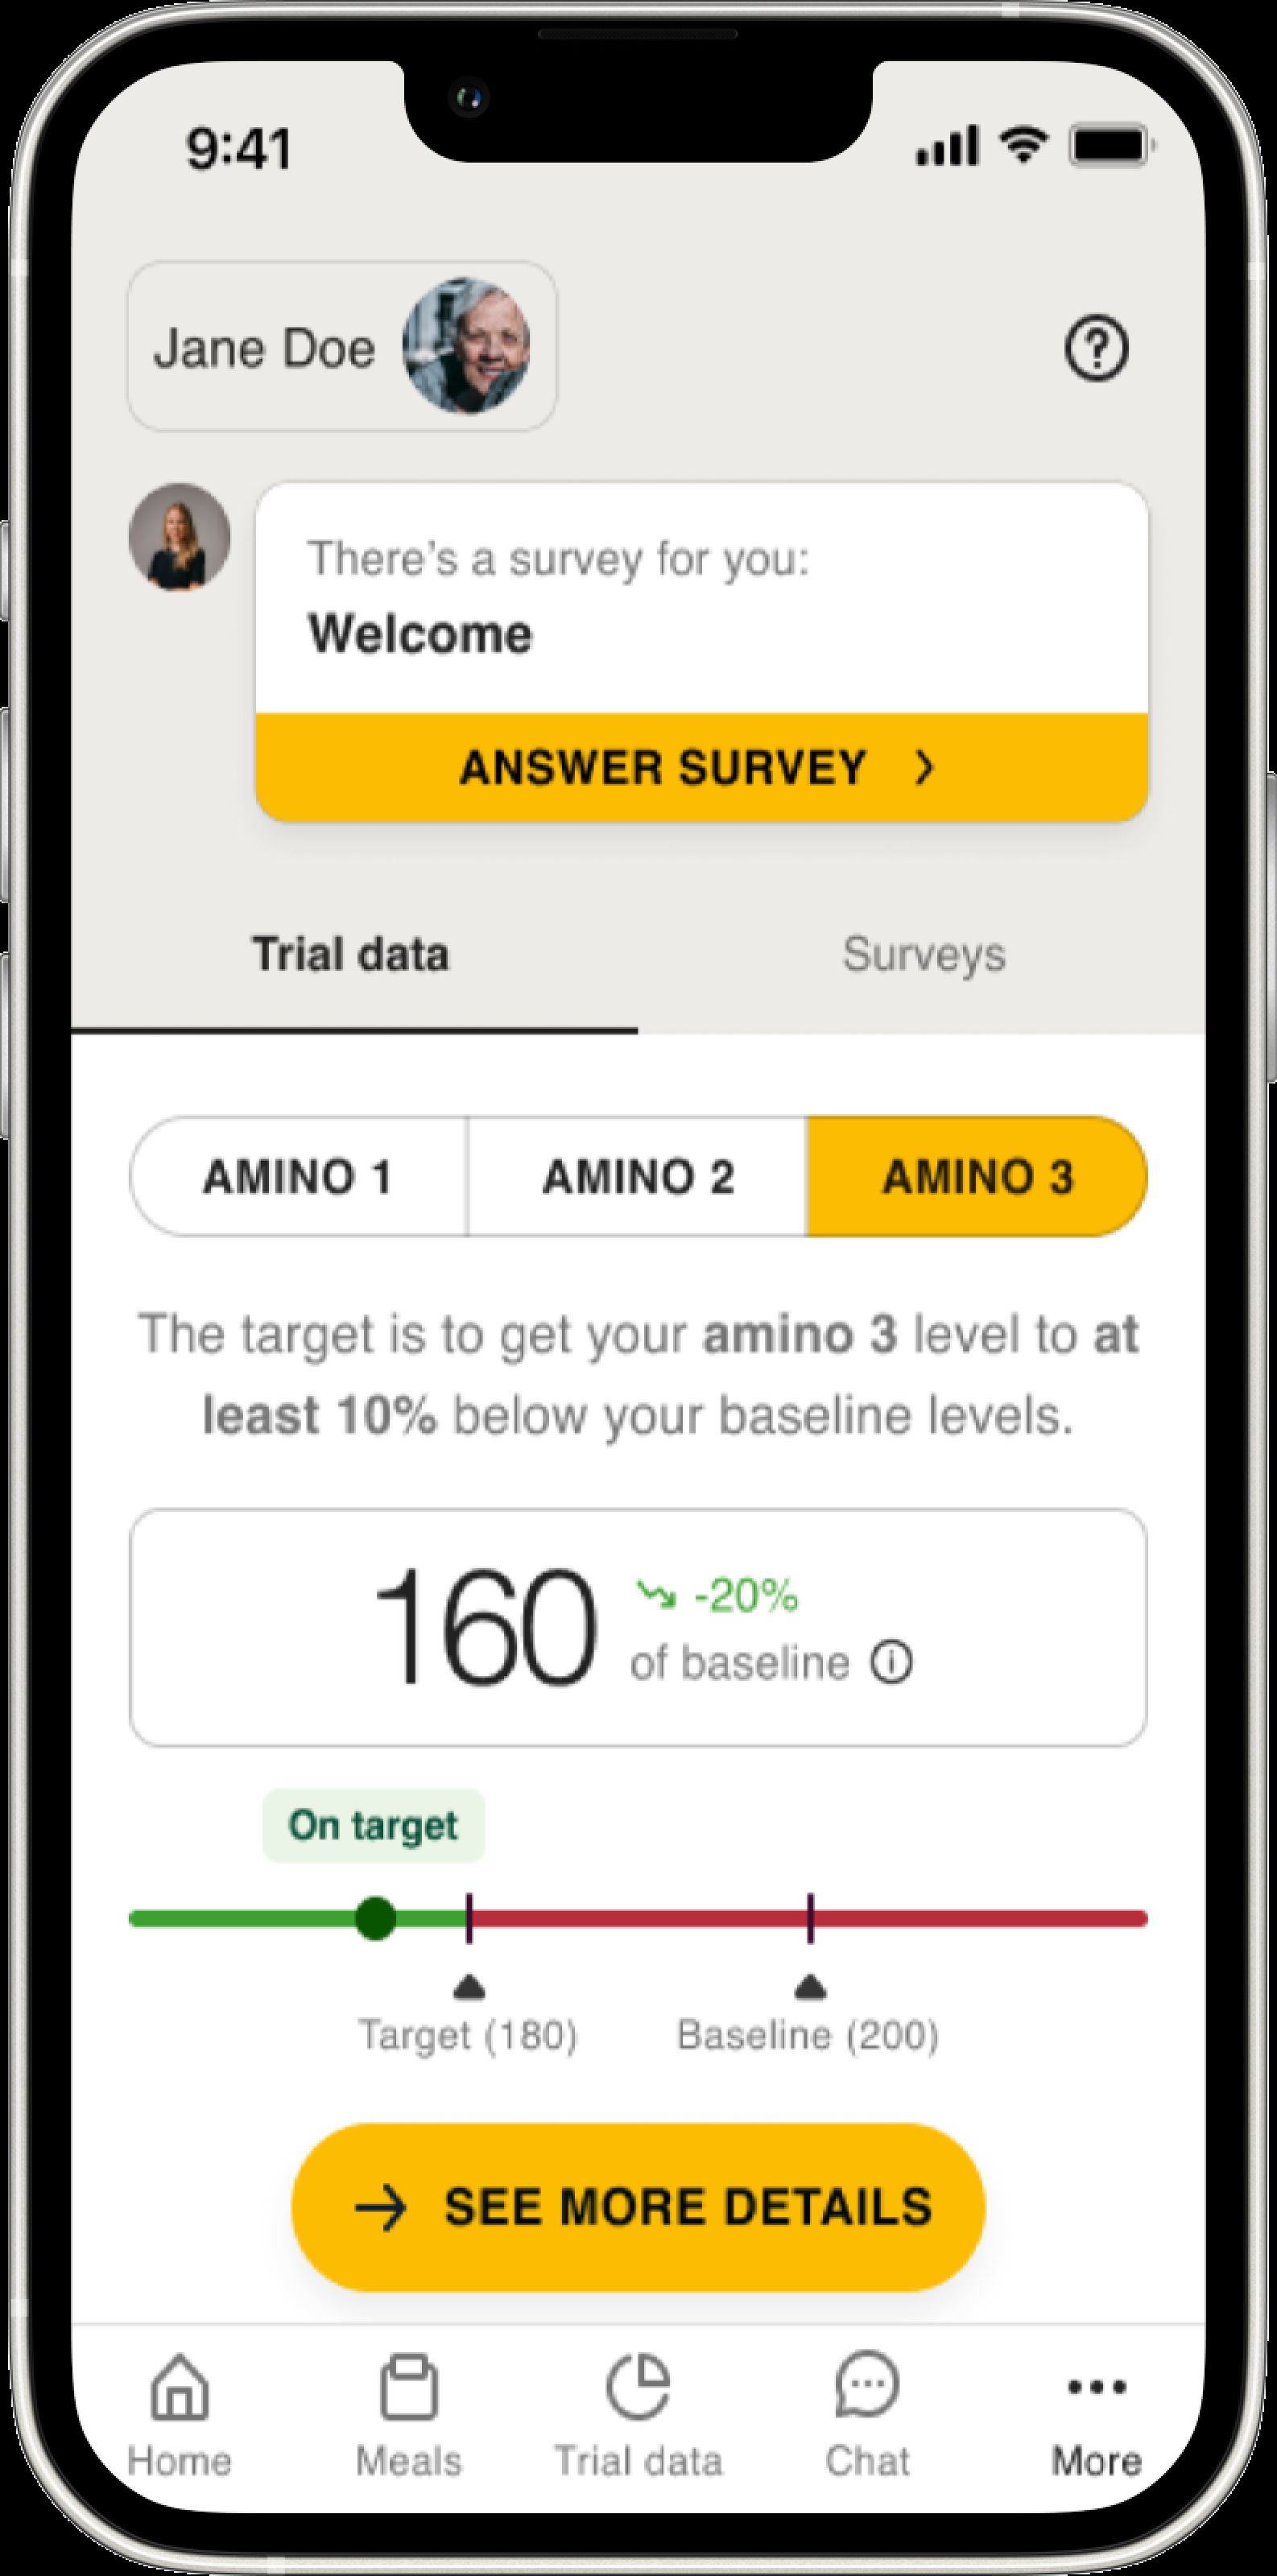
The primary challenge of this project was to design a data visualization solution that struck a balance between being informative and motivational for clinical trial participants—many of whom are elderly and not tech-savvy—while moving away from the traditional 'red = bad and green = good' semaphore paradigm. The team explored various data visualization chart types, experimented with UX writing to craft motivational language, and, most importantly, identified an overall score for the amino acid measures used by the clinical trial researchers, which was effectively presented in a user-friendly manner tailored to the needs of the participants.
What was your personal highlight in the development process? Was there an aha!-moment, was there a low point?
The project challenged traditional approaches by exploring innovative visualization options and pushing beyond the obvious. The 'a-ha' moment came when we discovered the amino acid overall score and began focusing on it. The lowest point was earlier, during the struggle to minimize the reliance on red and green visuals without yet breaking free from the paradigm.
Where do you see yourself and the project in the next five years?
We see ourselves still working with our client, improving their app and helping the clinical trial patients thru their cancer treatments. As long as our client is running clinical trial to fight cancer, the app will be there supporting them.
